AP Statistics is an college level introductory course that teaches students how to collect, analyze and interpret data. This class has taught me how to read a graph and how the data can be interpreted into context.
SOCS is something that we learned that helps us understand graphs to be able to describe the charateristics
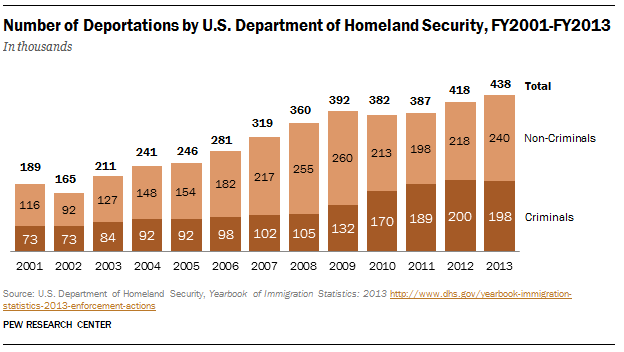
Shape-skewed to the left: Shows that as the years increase, more deportations happen
Outliers-no clear outliers: No data appears unusual or falls outside of the overall pattern
Center-median for total:319, for non-criminals:198, for criminals:102
Spread-Total:273, non-criminals:168, criminals:127
SOCS is something that we learned that helps us understand graphs to be able to describe the charateristics
Shape-skewed to the left: Shows that as the years increase, more deportations happen
Outliers-no clear outliers: No data appears unusual or falls outside of the overall pattern
Center-median for total:319, for non-criminals:198, for criminals:102
Spread-Total:273, non-criminals:168, criminals:127
